Choosing a model from a leaderboard is a little like hiring from a single exam score: two candidates with the same total can fail in completely different places. Models are no different — a model that leads on average can still fail consistently on specific skills, formats, or input types, and the average erases exactly that information. Report Cards offer an answer: have the evaluation system automatically write a natural-language behavior report for each model, then put the reports themselves through three checks.
One score cannot describe a model
Benchmarks — standardized test sets with automated scoring — are the infrastructure of model evaluation: objective, repeatable, easy to rank. But they compress performance on thousands of items into one scalar, and the information loss is structural. Two models both scoring 85 can fail in entirely different places — one on mathematical reasoning, the other on long-document understanding — and the score will show no difference.
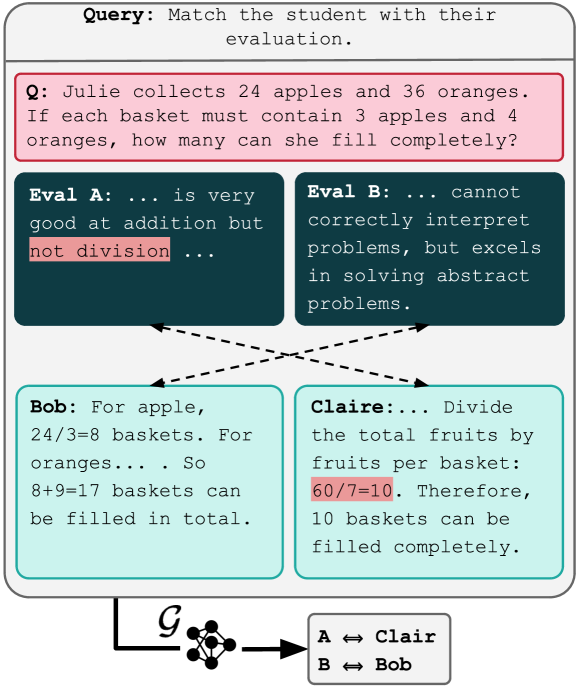
For teams putting models into real workflows, that difference is the question that matters: where will the model fail, what does the failure look like, and can the evidence be audited later? A leaderboard rank cannot answer it. The idea is right there in the name — a school report card: alongside the total grade, the teacher writes “strong in algebra, essays tend to drift off topic”, and parents know what needs work. Report Cards translate quantitative samples into readable behavior profiles, extending evaluation from “how many points apart” to “apart in what way”.
Teaching evaluation to write reports
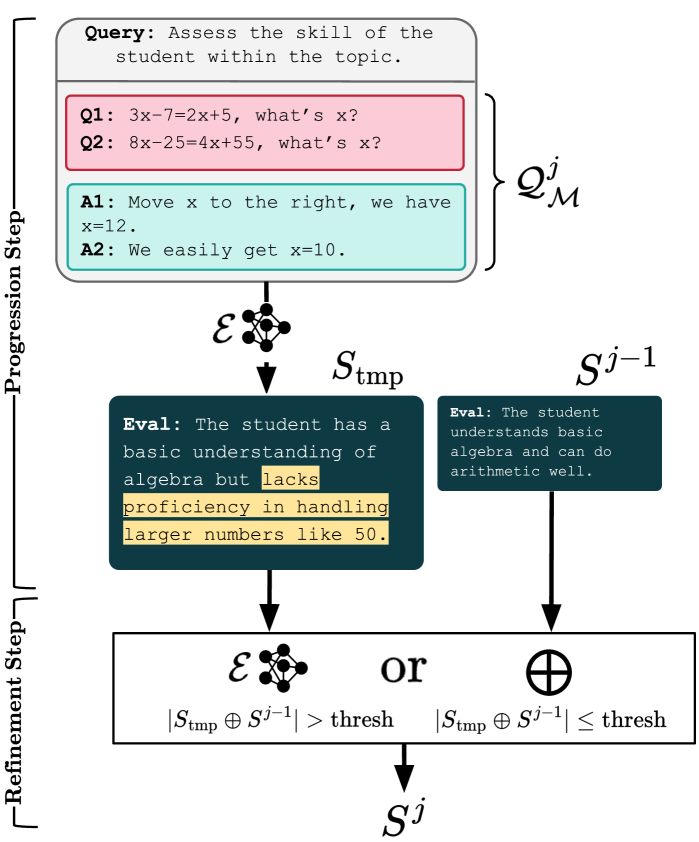
The system first collects model answers under a target skill, then uses the PRESS pipeline (a procedure that progressively compresses samples into a distilled summary) to organize subtopics, error modes, and strengths into a report. Generation is decomposed into reviewable intermediate steps so the output stays evidence-oriented rather than vague.
| Input | Model responses for a target skill or topic |
| Output | A human-readable natural-language behavior report |
| Metrics | Contrastive Accuracy, Card Elo, Human Scoring |
| Use cases | Model choice, deployment audit, capability regression analysis |
Do the reports hold up to scrutiny
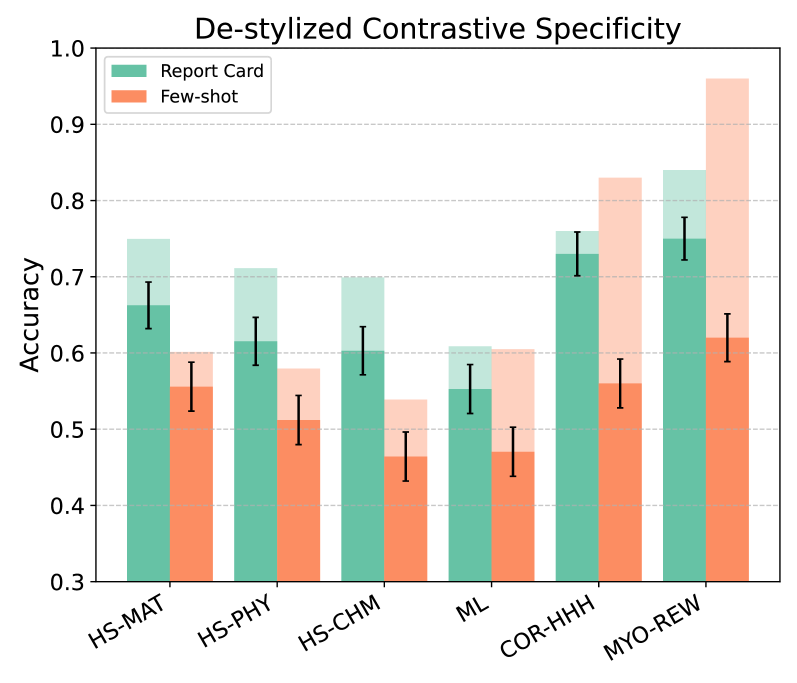
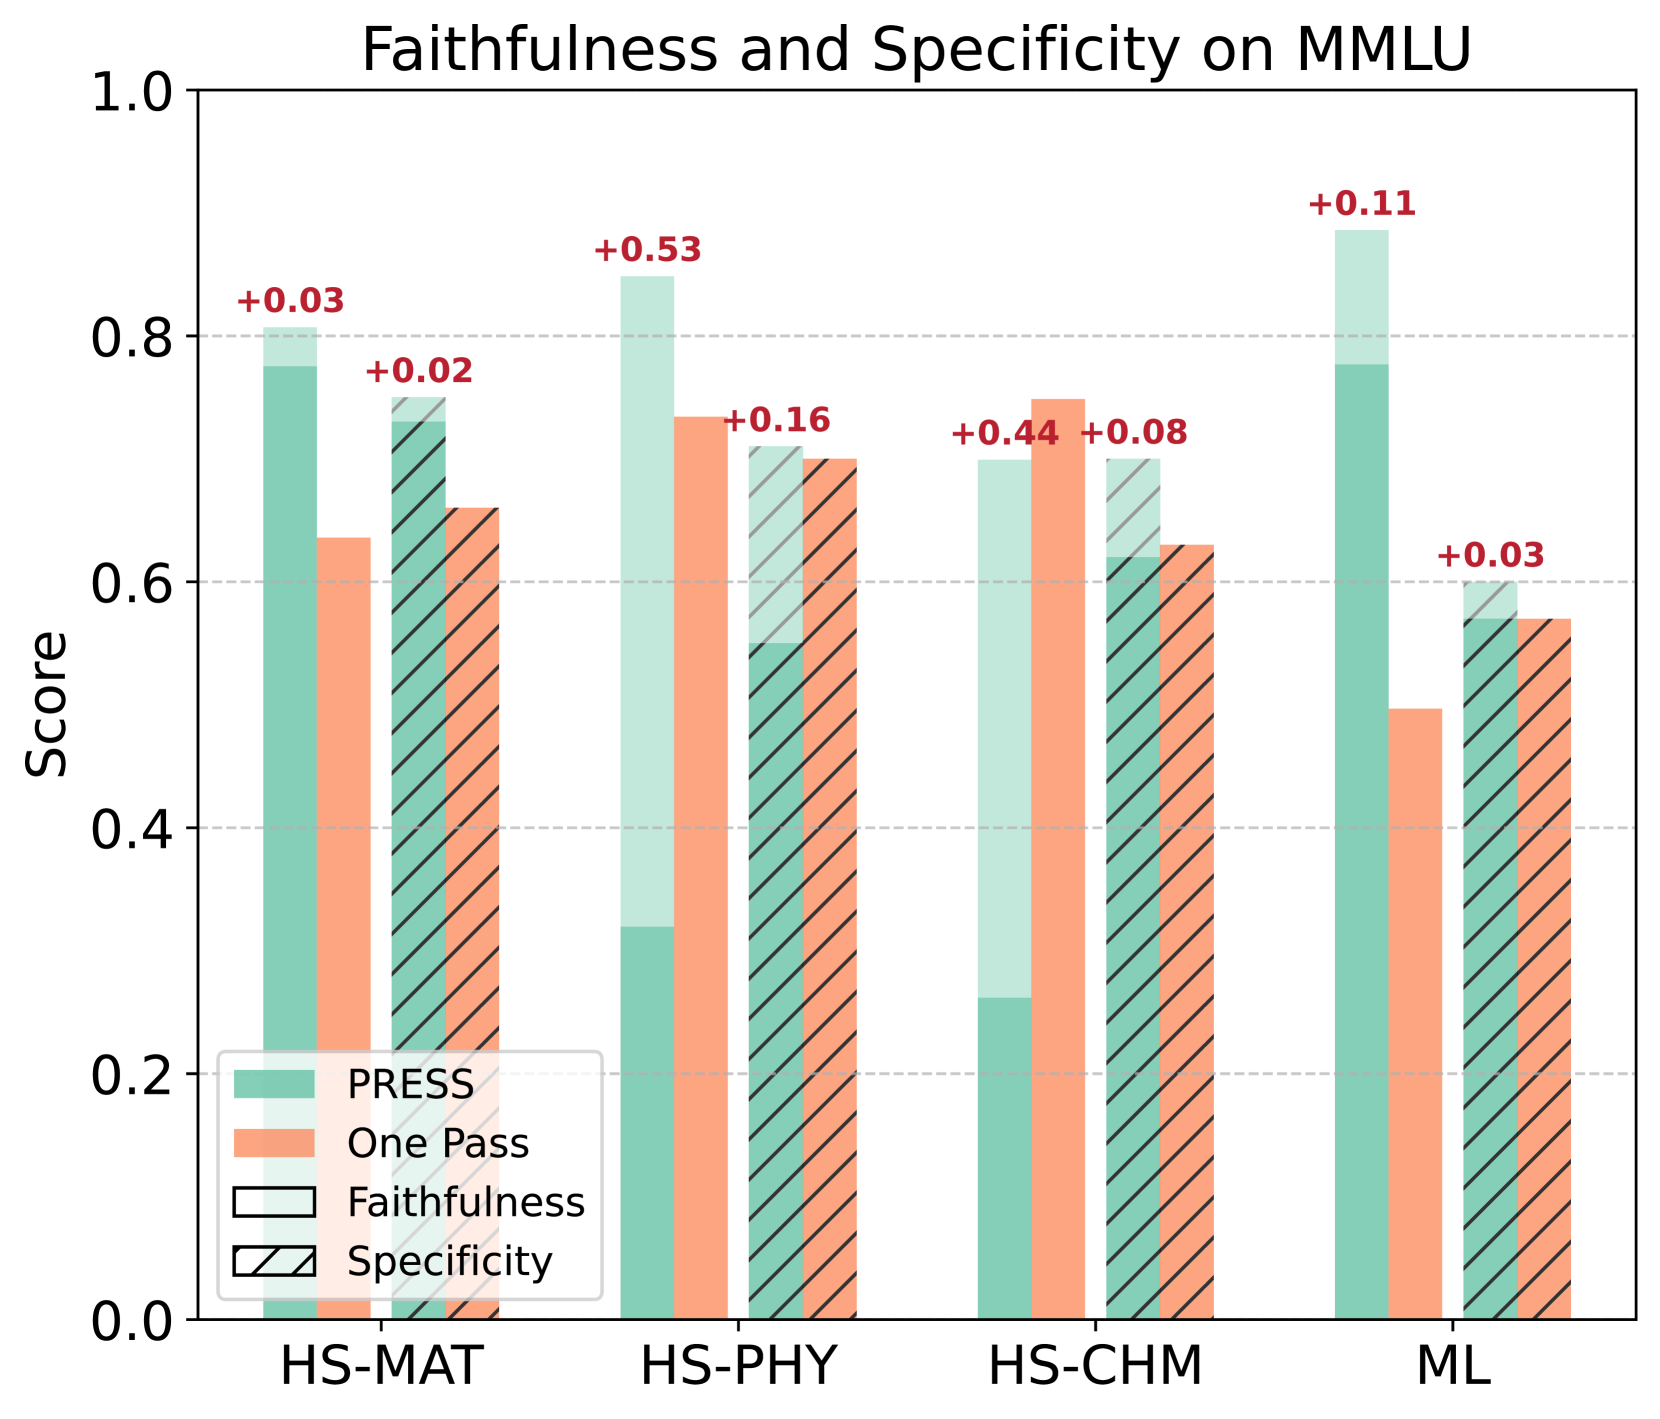
The biggest risk of auto-generated reports is a summary that sounds insightful but would fit any model. The paper therefore treats the report itself as the object under evaluation, with three checks: contrastive accuracy (judge which model produced a new output using only the report, and measure how often the judgment is right), Card Elo (a chess-style rating that ranks reports through pairwise comparisons), and human scoring on relevance, informativeness, and clarity.
The experiments show that strong reports help readers distinguish model behavior. A de-stylization experiment (re-testing after stripping stylistic cues) further shows the reports record behavioral differences independent of model voice — they compress behavior, not writing style.
- From score to behavior. Average scores still matter, but reports make failure modes decision-ready.
- An evaluation loop for the report itself. The paper avoids treating fluent prose as evidence by default.
- Useful for deployment review. Once a model enters a product, behavioral explanations matter more than leaderboard rank.
Toward auditable model evaluation
Read the paper and report artifacts
Open the project page, the interactive comparison dashboard, and the paper.