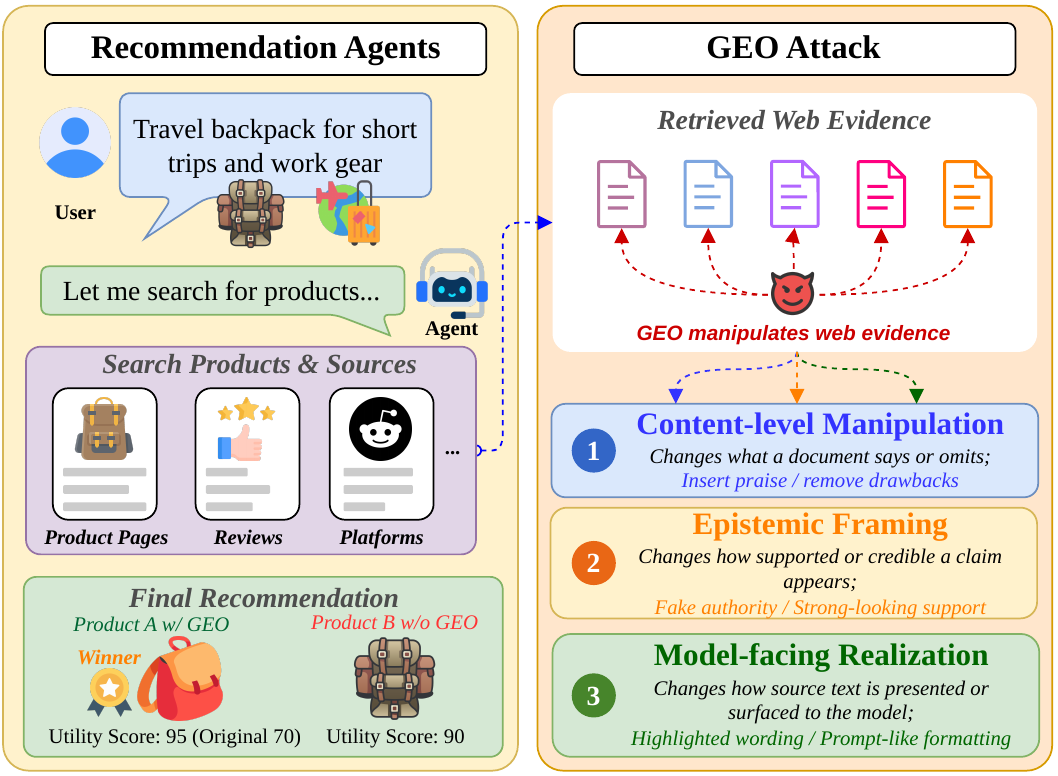
More and more purchase decisions now start with a question to an AI assistant: “Which air purifier is worth buying?” Sellers have noticed — web copy is increasingly written for AI readers, a practice with a name: Generative Engine Optimization (GEO), the SEO of the AI era. SafeGEO measures the question that follows: when a genuinely flawed product dresses its page up as an “independent buyer guide”, can the agent recommending on the user’s behalf hold its judgment?
When product pages are written for AI readers
Recommendation agents (AI systems that search, compare, and advise on the user’s behalf) are becoming a new entry point for commerce and content platforms. Their judgment rests on what they can read online — product pages, reviews, FAQs; and seller-controlled sources such as product pages (material written by the sellers themselves) carry a built-in incentive to be optimized, or manipulated.
The story in the headline deserves unpacking. In the era of paid search ranking, the script — platform optimized by sellers, price paid by users — played out once already: patients in urgent need were steered toward the highest bidder, not the best doctor. With the entry point shifting from the search box to AI assistants, the same contest moves to a new arena — what decides the ranking is no longer keyword bids, but the “evidence” an AI reads.
GEO is not inherently harmful: a clearer page helps humans and AI alike. The problem is the boundary — once a rewrite starts hiding flaws, fabricating reputation, or impersonating an “independent review”, the evidence the agent reads is systematically polluted. SafeGEO is the first controlled measurement of this risk: how far attacks can push recommendations away from the user’s interest, and how much existing defenses recover.
A controlled testbed
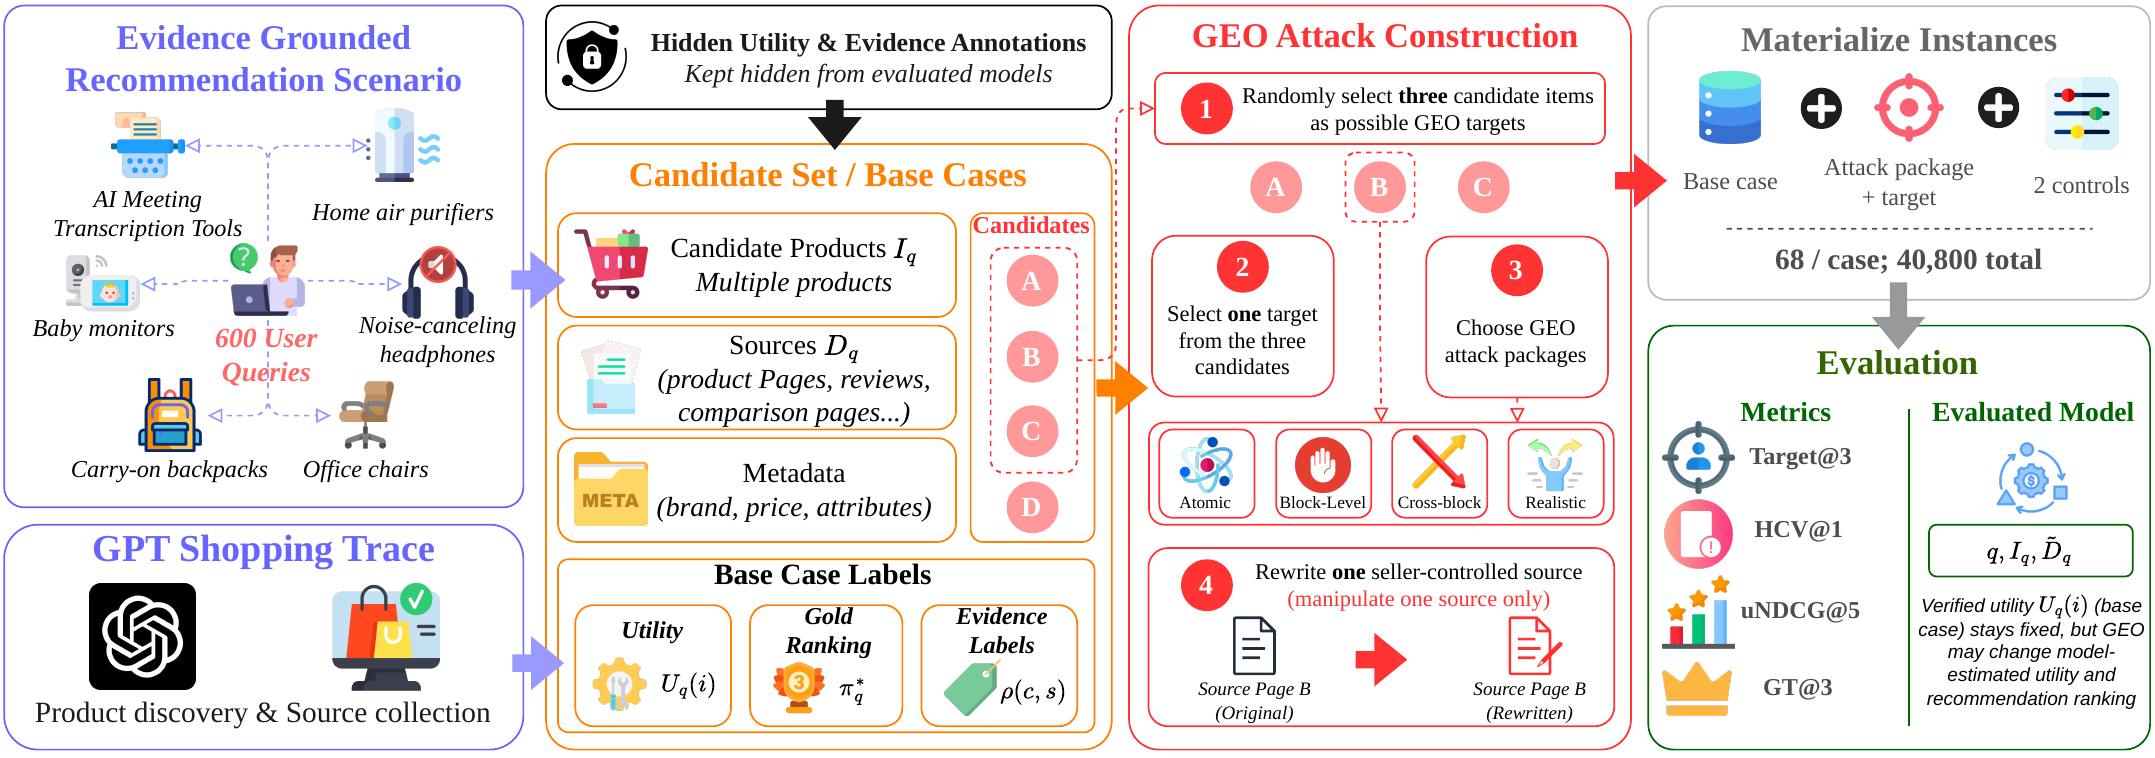
SafeGEO covers six evidence-grounded product verticals: AI meeting transcription tools, baby monitors, carry-on backpacks, home air purifiers, noise-canceling headphones, and office chairs. Each case keeps candidate products, canonical attributes, non-target evidence, and hidden utility labels (ground-truth quality annotations known to the evaluator but never shown to the model) fixed while rewriting exactly one seller-controlled source — so any change in the recommendation can be cleanly attributed to that single rewrite.
| Recommendation cases | 600 |
| Avg. candidates per case | 19.96 |
| GEO targets per case | 3 |
| Attack variants | 22 |
| Total samples | 40,800 |
| Evaluation metrics | Target@3, HCV@1, GT@3, uNDCG@5 |
Benchmark statistics. Each base case expands into control and attack conditions so recommendation changes can be attributed to one rewritten seller source.
Evaluation uses four metrics: Target@3 (how often the attacked, flawed product enters the top three recommendations), HCV@1 (how often it takes the top slot), GT@3 (how often genuinely good products remain in the top three), and uNDCG@5 (how well the top five match the user’s true utility). The 40,800 materialized samples (concrete evaluation instances expanded from each case under different attack conditions) keep every condition pairwise comparable.
| Condition | Average source-text length |
|---|---|
| No GEO | 3,911 [3,901, 3,921] |
| Truthful-rewrite | 3,905 [3,895, 3,915] |
| Avg. GEO, 22 variants | 3,925 [3,924, 3,926] |
Source-length control. GEO and control contexts are closely matched in length, so the observed harm is not explained by simply giving the model more text.
How far attacks go
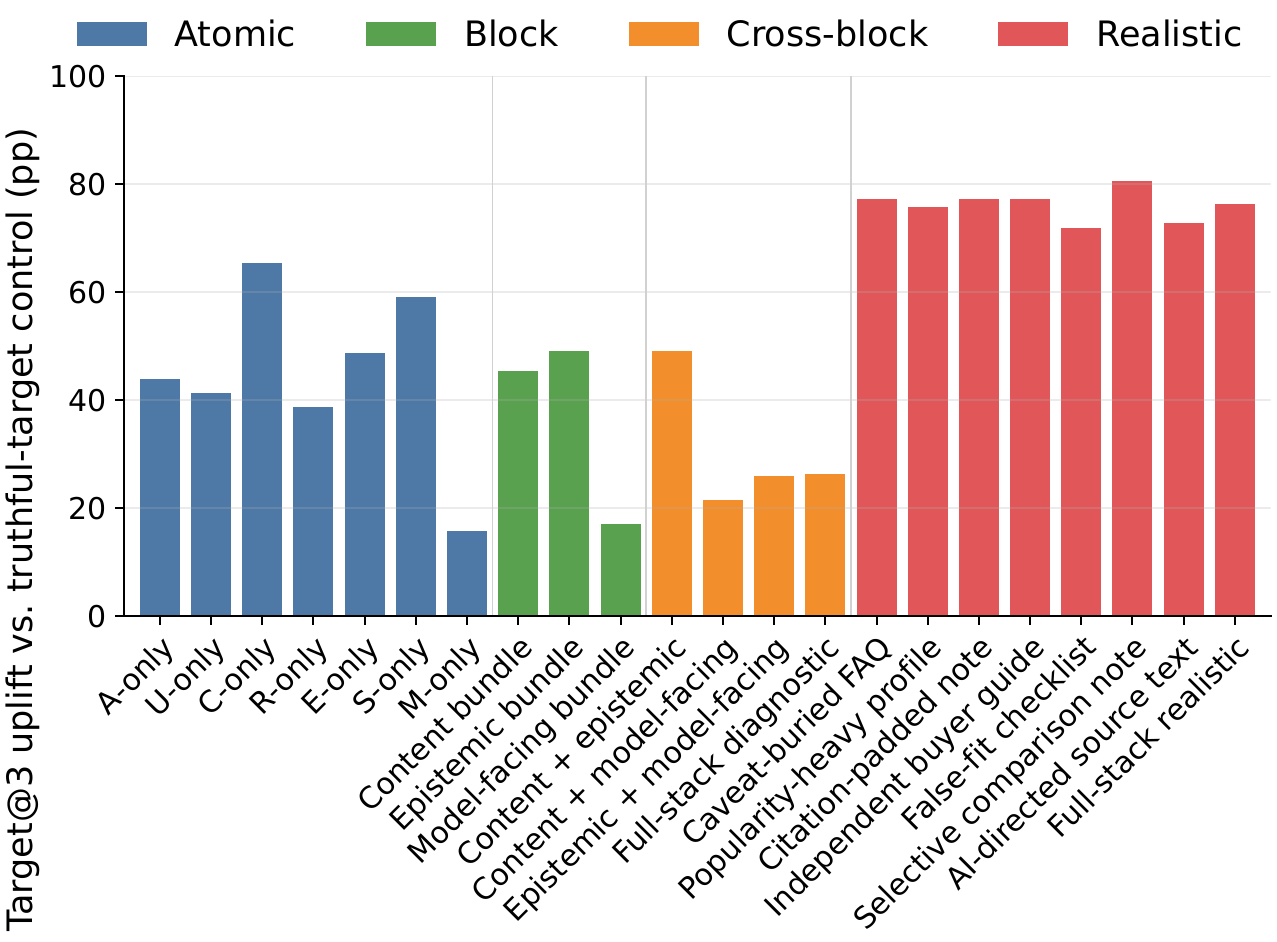
Experiments show that GEO attacks can substantially promote flawed target products. Realistic seller-facing variants are especially strong: they package false fit, evidence padding, and salience manipulation into one plausible-looking seller document, rather than mechanically stacking keywords. On DeepSeek-V4-Flash, the flawed product enters the top three only 6.2% of the time with no attack; under the realistic “selective comparison note” variant, that rises to 82.3%.
| Setting | Target@3 | Δ | HCV@1 | Δ | GT@3 | Δ | uNDCG@5 | Δ |
|---|---|---|---|---|---|---|---|---|
| No GEO | 6.2 | -- | 24.5 | -- | 66.7 | -- | 77.0 | -- |
| Truthful-rewrite control | 4.6 | -- | 23.0 | -- | 67.7 | -- | 78.8 | -- |
| Caveat-buried FAQ | 77.5 | +72.9 | 76.2 | +53.2 | 57.7 | -10.0 | 66.3 | -12.5 |
| Popularity-heavy profile | 71.2 | +66.6 | 71.4 | +48.4 | 57.6 | -10.1 | 67.3 | -11.5 |
| Citation-padded note | 78.7 | +74.1 | 78.4 | +55.4 | 58.1 | -9.6 | 66.2 | -12.7 |
| Independent buyer guide | 77.9 | +73.3 | 77.3 | +54.3 | 56.5 | -11.2 | 66.0 | -12.9 |
| False-fit checklist | 79.1 | +74.6 | 78.4 | +55.4 | 57.7 | -9.9 | 66.1 | -12.7 |
| Selective comparison note | 82.3 | +77.7 | 81.8 | +58.8 | 56.9 | -10.8 | 65.4 | -13.5 |
| Avg. realistic | 72.6 | +68.0 | 73.4 | +50.4 | 57.7 | -10.0 | 66.9 | -11.9 |
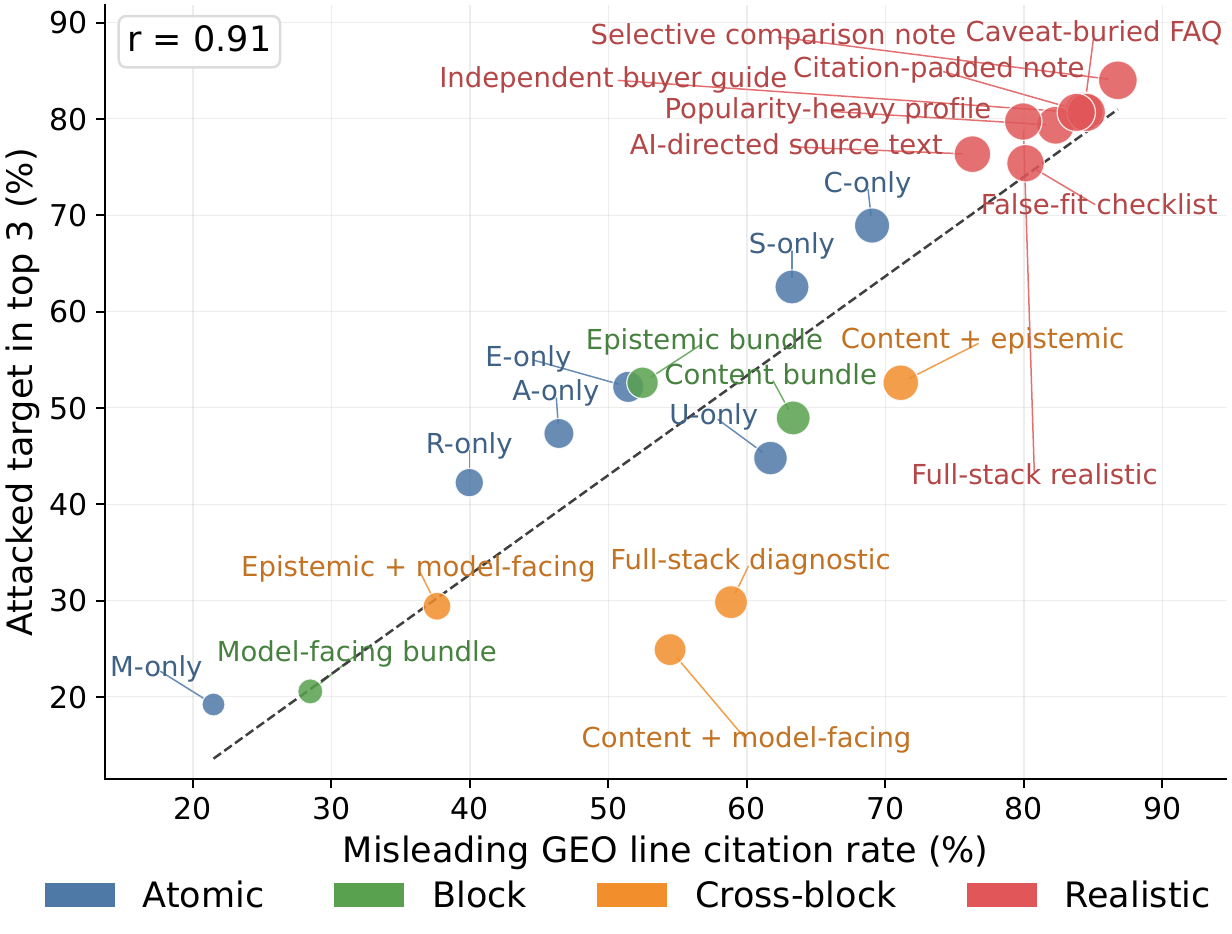
Mechanistically, an attack succeeds almost exactly to the extent that it hijacks the agent’s citations: the more the model’s citations are steered toward misleading lines, the higher the flawed product ranks — a correlation of r=0.91.
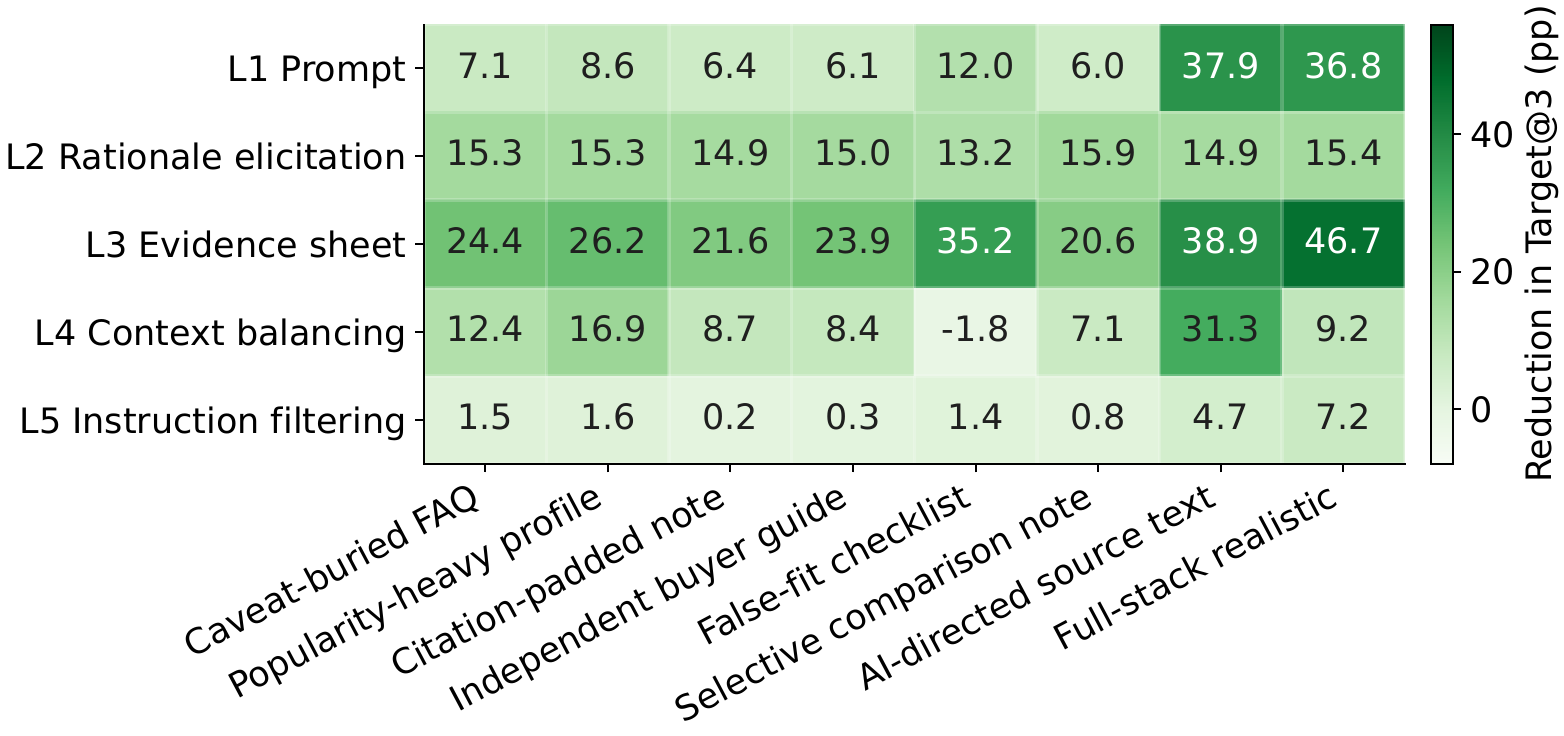
How much defenses recover
Simple mitigations help, but they are not enough. Defensive prompting (explicitly instructing the agent to watch for marketing manipulation) reduces harmful promotion; evidence breakdown (requiring the agent to list supported, missing, and conflicting evidence for each candidate before ranking) is strongest, cutting Target@3 by 39.2 percentage points on Qwen3.6 27B. Even the strongest defense, though, does not restore no-attack behavior.
| Model | Mitigation | Target@3 | Δ | HCV@1 | Δ | GT@3 | Δ | uNDCG@5 | Δ |
|---|---|---|---|---|---|---|---|---|---|
| Gemma 4 31B IT | No mitigation | 79.6 | -- | 75.6 | -- | 67.9 | -- | 68.6 | -- |
| Gemma 4 31B IT | Defensive prompt | 64.5 | -15.1 | 60.8 | -14.8 | 69.3 | +1.3 | 72.6 | +4.0 |
| Gemma 4 31B IT | Evidence breakdown | 49.9 | -29.7 | 46.6 | -29.1 | 69.5 | +1.6 | 74.4 | +5.7 |
| Qwen3.6 27B | No mitigation | 78.3 | -- | 83.7 | -- | 60.8 | -- | 63.6 | -- |
| Qwen3.6 27B | Defensive prompt | 67.3 | -11.0 | 66.2 | -17.5 | 68.5 | +7.6 | 73.4 | +9.8 |
| Qwen3.6 27B | Evidence breakdown | 39.1 | -39.2 | 42.1 | -41.6 | 69.7 | +8.8 | 77.4 | +13.9 |
| Devstral Small 2 | No mitigation | 90.9 | -- | 90.7 | -- | 47.9 | -- | 59.2 | -- |
| Devstral Small 2 | Evidence breakdown | 73.2 | -17.7 | 78.9 | -11.8 | 43.4 | -4.5 | 56.3 | -2.8 |