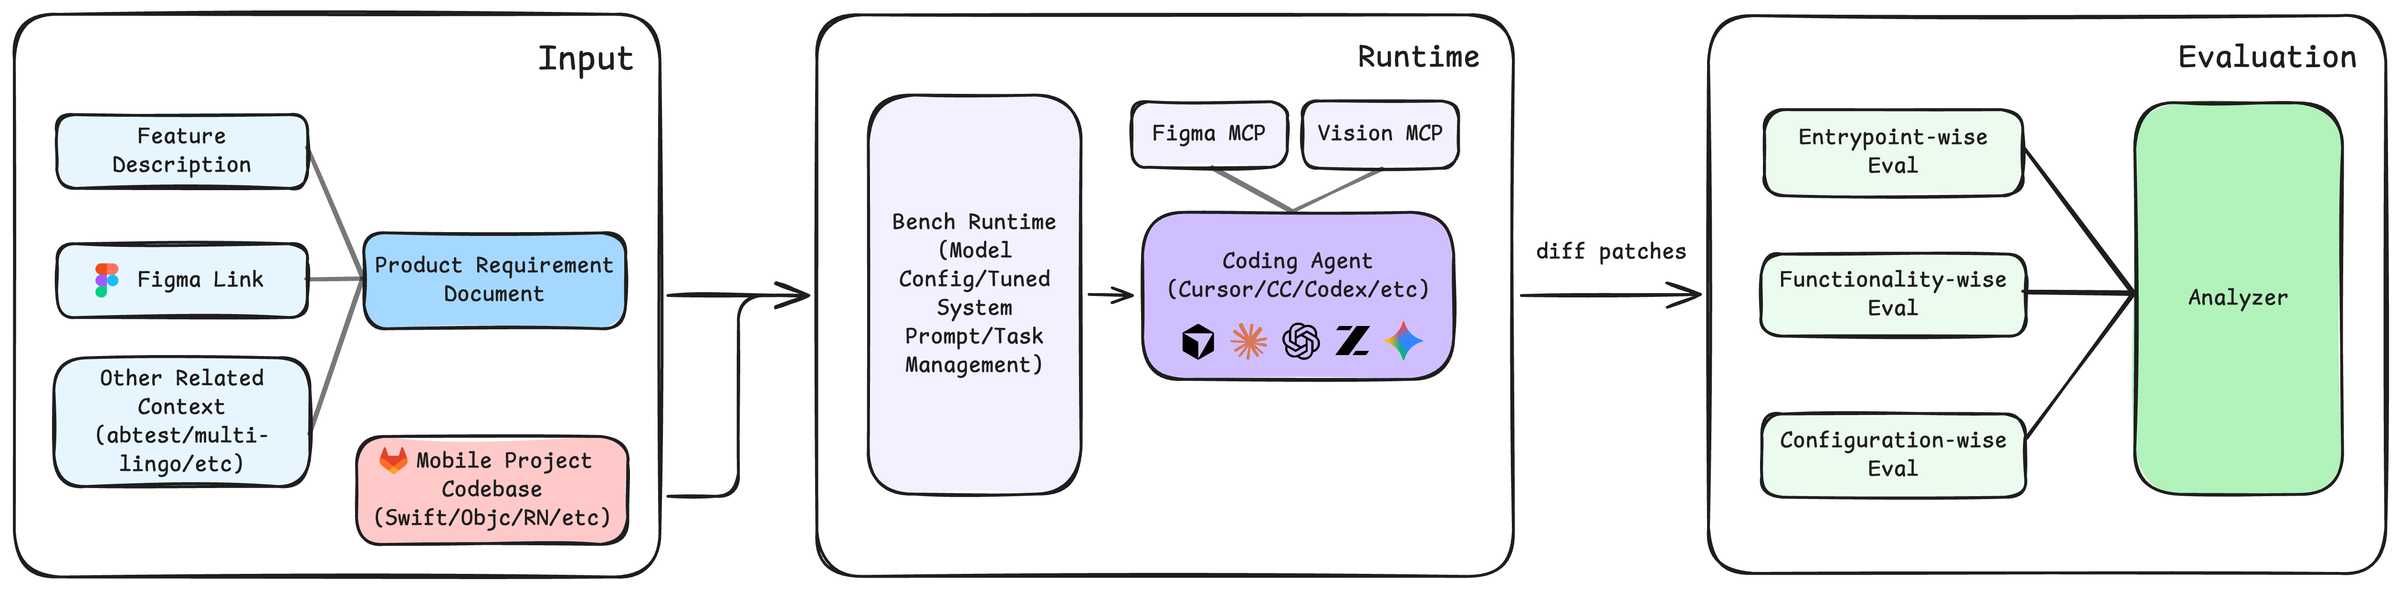
SWE-Bench Mobile moves agent-coding evaluation out of open-source GitHub repos and into a real, shipping mobile product. Fifty engineering tasks from Xiaohongshu's production iOS app — each with its original PRD, Figma design, and a hand-written test suite — ask agents to read multi-modal specs and work inside a roughly 500K-line mixed Swift/Objective-C codebase the way a real iOS engineer does.
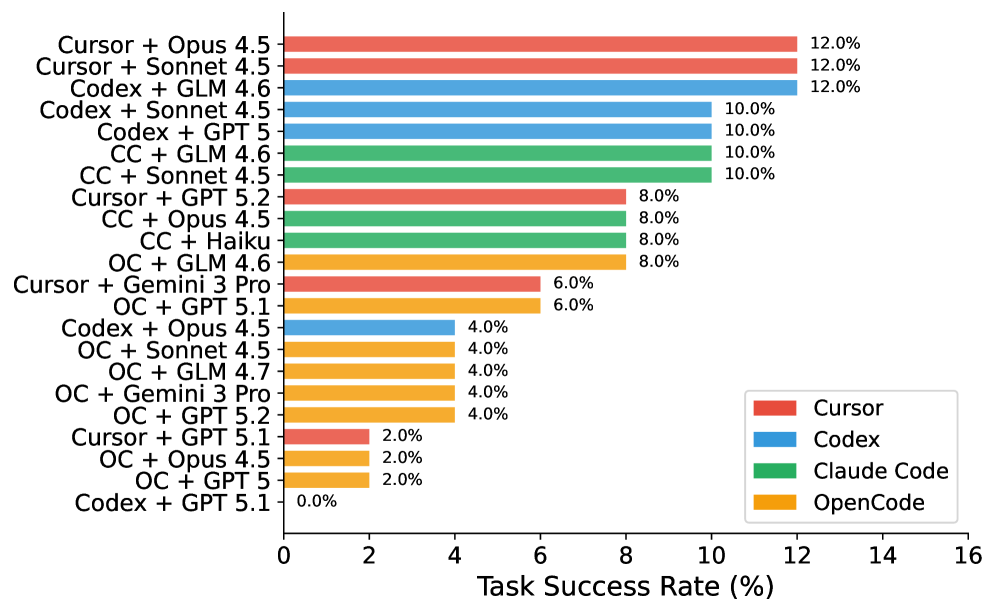
The results draw a clear capability boundary: even the strongest commercial agent + model combos solve only 12%. And which agent you pick matters as much as which model — same model, different scaffold (the agent framework that drives the model to read code, edit, and run tests), pass rate can swing up to 6×. Much as the same chef cooks differently in a different kitchen — the stove and the workflow matter as much as the craft. The paper is now in KDD 2026's Applied Data Science Track at the main conference (CCF-A).
Why we built it
Prior agent-coding benchmarks miss real-world engineering in four ways at once. Open-source repos may leak into pretraining; tasks are bug fixes rather than new features; specs are GitHub issues rather than design documents; and the tests usually already exist. SWE-Bench Mobile reverses all four. The codebase is a real production iOS app, the tasks are feature additions backed by PRDs and Figma designs, and the evaluation harness is hosted-only — keeping test sets out of training data by design.
What's in the benchmark
| Source | Xiaohongshu (Little Red Book) production iOS app |
| Languages | Swift + Objective-C (mixed) |
| Tasks | 50 |
| Test cases | 449 (~9 per task) |
| Codebase size | ~500K lines of code |
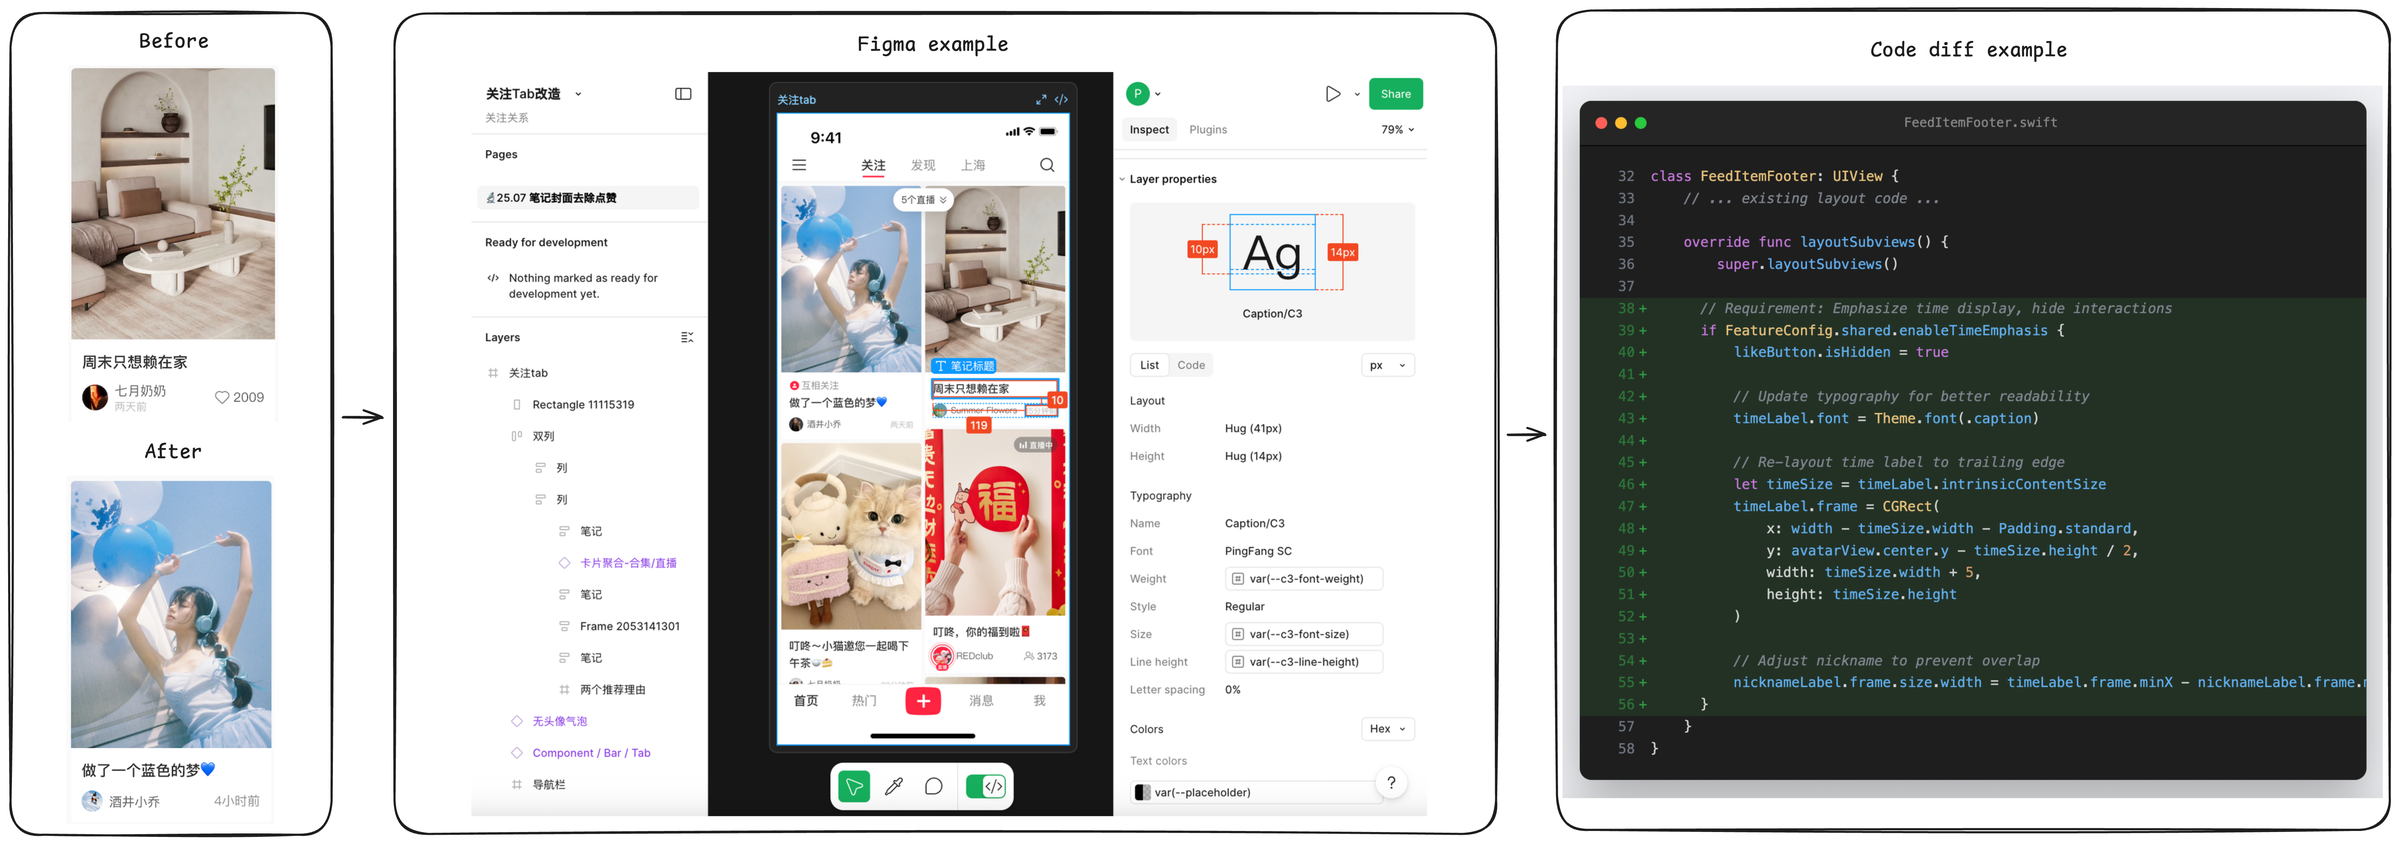
| Inputs per task | PRD + Figma design + codebase snapshot (multi-modal) |
| Output | unified diff |
| Visual assets | 35 tasks include Figma designs; 46 include reference images |
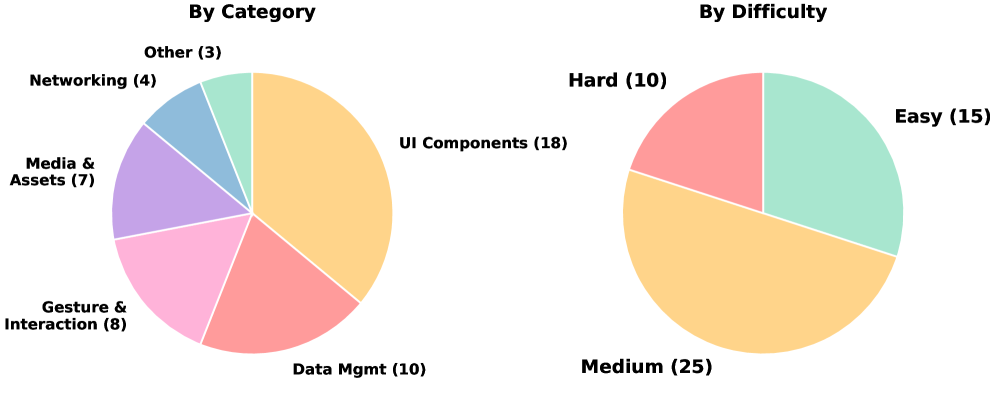
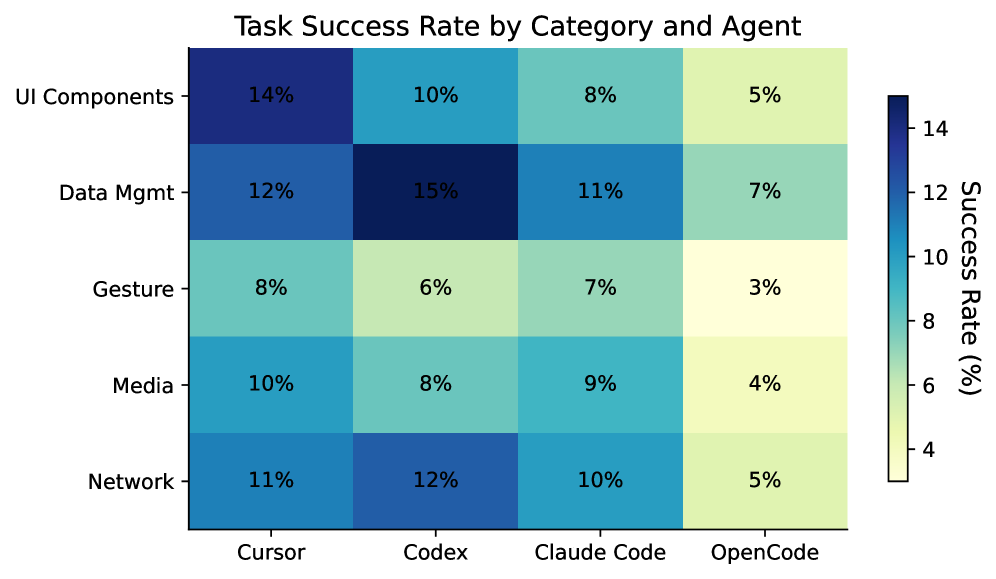
| Task mix | UI Components 18 · Data Management 10 · Gestures 8 · Media 7 · Networking 4 · Other 3 |
| Task type | feature additions (not bug fixes) |
| Evaluation | hosted-only (anti-contamination) |
Benchmark composition. Task type is the most consequential difference from prior agent benchmarks: feature additions force the agent to build something, not just fix something.
Results
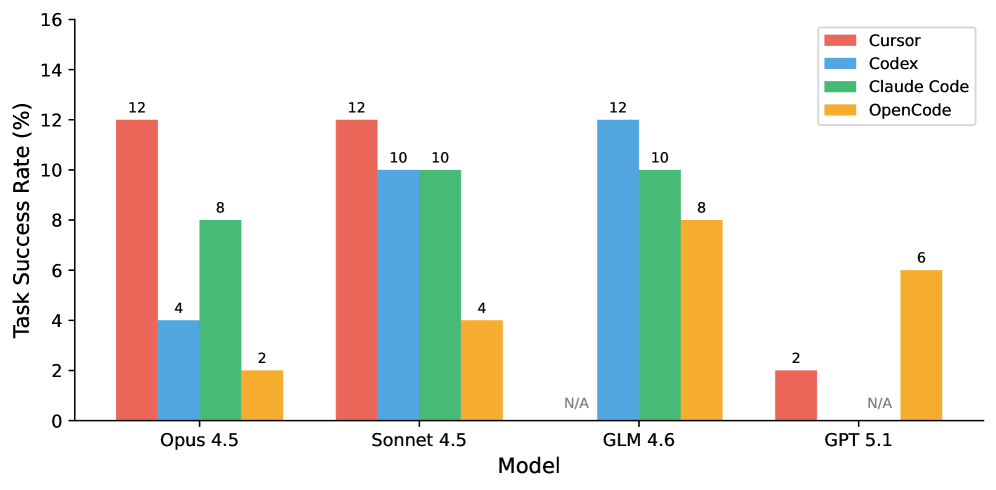
Twenty-two agent–model configurations were evaluated across four agents (Cursor, Codex, Claude Code, OpenCode) crossed with leading commercial and open models. Top of the leaderboard:
| Agent + Model | Tasks solved | Tests passed |
|---|---|---|
| Cursor + Claude Opus 4.5 | 12.0% | 28.1% |
| Cursor + Claude Sonnet 4.5 | 12.0% | 26.7% |
| Codex + GLM 4.6 | 12.0% | 19.6% |
Top of the SWE-Bench Mobile leaderboard. The three leaders are tied at 12% task pass rate but separated by 8.5 pp on tests — a coarse vs. fine-grained capability gap. Live results: swebenchmobile.com.
What we found
- Same model, different agent — up to 6× spread. Scaffolding rivals model choice in importance.
- Simple beats elaborate. A "Defensive Programming" prompt outperforms more elaborate prompting strategies by +7.4 pp.
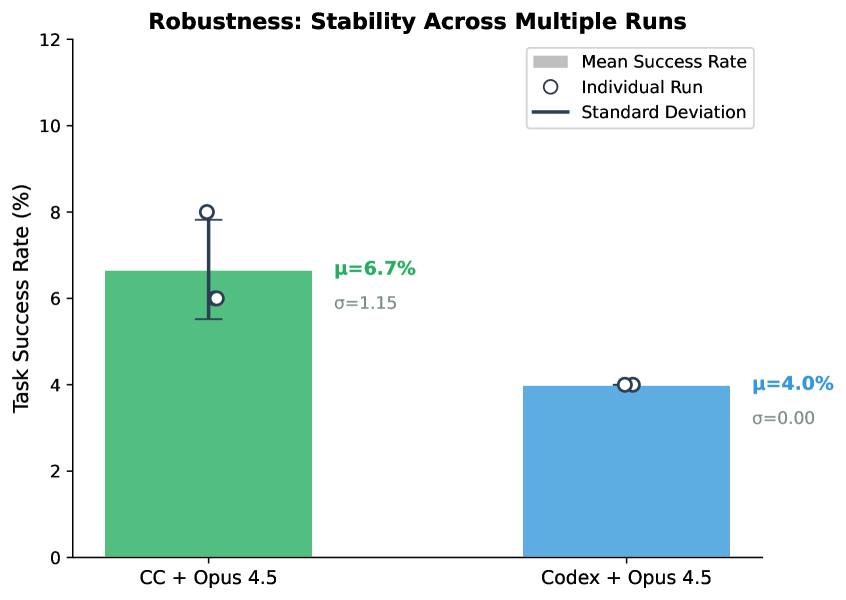
- The tests-passed column matters. Tasks that look "failed" at the binary level often pass a meaningful fraction of their tests — useful signal that's invisible if you only track pass@1.
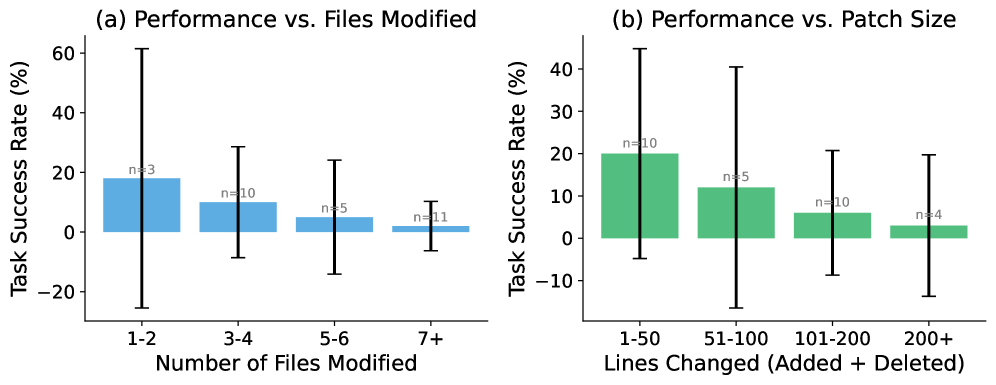
- Complex engineering remains hard. Tasks touching 7+ files fall to 2% success, while small localized changes are far easier.
- Production deployment practices trip agents up. Common failures include missing feature flags, data models, files, UI components, and required methods.
The same model can vary up to 6× across agents. Reports that name only the LLM are missing half the story.
Why it matters
Signal for the field
SWE-Bench Mobile is not a pessimistic result. A 12% strict task success rate shows that today's agents are still far from autonomous mobile engineers; a 28.1% top test-pass rate shows they already do meaningful partial work inside real code. The practical read is sharper: coding agents are useful copilots, but not yet ready to independently own complex mobile feature delivery.
Evaluate on SWE-Bench Mobile
Hosted challenge. Public leaderboard. Submit your agent + model and see where you land on real production iOS work. Paper now in KDD 2026 Main Conference (CCF-A).